Along with the source code, the algorithm and flowchart for Pascal’s triangle is a common problem in any high level language, especially C and C++. In this post, I have presented a simple algorithm and flowchart for Pascal’s triangle along with a brief introduction to Pascal’s triangle, it’s generation mechanism and some of its important properties. Both the algorithm and flowchart are generate Pascal’s triangle in standard format as per the number of rows entered by the user.
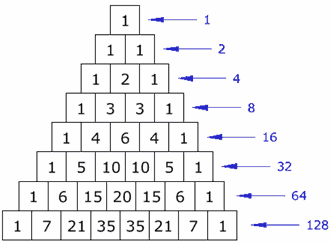
Pascal’s Triangle is a system of numbers arranged in rows resembling a triangle with each row consisting of the coefficients in the expansion of (a + b)n for n = 0, 1, 2, 3. The construction of the triangular array in Pascal’s triangle is related to the binomial coefficients by Pascal’s rule. Before going through the Pascal’s triangle algorithm and flowchart, here’s a look at it’s properties, and more importantly how the triangle is generated.
How to Generate Pascal’s Triangle?
Most of us who are familiar with Pascal’s triangle don’t know that the numbers outside the triangle are all “0”‘s. And, these “0”s are very important for the triangular pattern to work so as to form a triangular array. The triangle starts with a number “1” at the top, and each new number added below the top “1″ is just the sum of the two numbers above, except for the edge which are all “1″s. Here’s how the rows are formed:
0 row =1
1 row = (0+1), (1+0) = 1, 1
2 row = (0+1), (1+1), (1+0) = 1, 2, 1
3 row = (0+1), (1+2), (2+1), (1+0) = 1, 3, 3, 1
4 row = (0+1), (1+3), (3+3), (3+1), (1+0) = 1, 4, 6, 4, 1
Properties of Pascal’s Triangle:
- In Pascal’s triangle, the sum of all the numbers of a row is twice the sum of all the numbers of the previous row. So, the sum of 2nd row is 1+1= 2, and that of 1st is 1. Again, the sum of 3rd row is 1+2+1 =4, and that of 2nd row is 1+1 =2, and so on. This major property is utilized here in Pascal’s triangle algorithm and flowchart.
- The edges, left and right, of the triangle consist of “1”s only.
- And, all the elements outside the triangle are “0”s.
- The sequence of the product of each element or number is related to e, the base of the natural logarithm.
- The diagonal next to the edge diagonal, in both left and right, contain natural numbers (1, 2, 3, ….) in order.
- The sum of the squares of the numbers of row “n” equals the middle number of row “2n”.
Pascal’s Triangle Algorithm:
- Start
- Declare variables x, y, n, a, z, s
- Enter the limit
- Initialize the value of variables, s=n , x=0, y=0 , z=s
- Do the following operations in loop
- x = 0 to n
- a= 1, x++
- z=s to 0
- print space
- z—-
- y = o to x
- print a
- a = a*(x-y)/(y+1)
- y= y+1
- go to next line
- Repeat the process to n
- Print the final required triangle
- Stop
Pascal’s Triangle Flowchart:
 Also see,
Pascal’s Triangle C Program
The algorithm and flowchart for Pascal’s triangle discussed here can be used to write source code for Pascal’s triangle in any high level programming language. If you have any queries regarding this algorithm or flowchart, mention and discuss them in the comments section below.
Pascal’s Triangle Algorithm and Flowchart: An In-depth Analysis – Python
If you’re into combinatorics, or just want to show off a cool pattern at a party, Pascal’s Triangle should be on your radar! This triangular array is not just an assortment of numbers but an elegant representation of binomial coefficients. Let’s dive deep into understanding the algorithm and the flowchart behind this mathematical beauty!
The Basics of Pascal’s Triangle
Pascal’s Triangle is an array of binomial coefficients. It starts with a single ‘1’ at the top. As we move downward, each number is the sum of the two numbers directly above it.
How is it Constructed?
Starting with the second row, the value of each entry is obtained by adding the number above and to the left with the number above and to the right. For edges, where there’s only one number above, the value is replicated.
For instance:
1
1 1
1 2 1
1 3 3 1
...
Algorithm to Generate Pascal’s Triangle
Generating Pascal’s Triangle requires a nested loop. The outer loop tracks the row number while the inner loop calculates the values in that row.
The Algorithm
- Start with an outer loop from
i=0ton. - Initialize a variable
valas 1, which will be used to print the coefficient in a particular row. - Run an inner loop from
j=0toi. - Print
val. - Update the value of
valusing the formula:val = val * (i - j) / (j + 1).
Example Program Code
def print_pascals_triangle(n):
    for i in range(0, n):
        val = 1
        for j in range(0, i + 1):
            print(val, end=" ")
            val = val * (i - j) // (j + 1)
        print()

# Let's generate 5 rows
print_pascals_triangle(5)
CODE Explanation
The outer loop runs for each row. In the inner loop, we calculate each coefficient using the formula and print it. The formula is derived from the properties of Pascal’s Triangle.
Expected Output
1
1 1
1 2 1
1 3 3 1
1 4 6 4 1
Flowchart behind the Algorithm
Constructing a flowchart for Pascal’s Triangle gives a visual representation of how the algorithm works.
Flowchart Description
- Start
- Initialize
i = 0. - If
i<n, enter the loop. Else, go to the end. - Initialize
val = 1andj = 0. - If
j<=i, printvaland updatevalusing the formula. Increasejby 1. - Once all coefficients in a row are printed, move to the next line.
- Increase
iby 1. - Repeat steps 3 to 7 until all rows are printed.
- End.
Benefits of Understanding the Algorithm and Flowchart
Understanding the Pascal’s Triangle algorithm and flowchart not only strengthens your foundational knowledge of combinatorics but also equips you with the skills to tackle more complex patterns and sequences in mathematics and computer science.
Real-world Applications
From calculating coefficients in polynomial equations to determining combinations in probability, the applications of Pascal’s Triangle are vast and varied.


is Flowchart true.do you have an idea.
The following is a BASIC implementation (tested using the BaCon BASIC to C converter) of the Pascal’s triangle algorithm:
REM pascal.bac
REM BaCon program to generate Pascal’s triangle
REM Change n for different number of rows
REM Variables are x, y, n, a, z, s
REM n = number of rows to generate
n = 5
REM Initialize variables
s = n: x = 0: y = 0: z = s
REM Print initial “1”
PRINT 1
REM Outer loop
WHILE x <= n
a = 1: x = x + 1
IF z < 0 THEN
PRINT " ";
END IF
z = z – 1
REM Inner loop
FOR y = 0 TO x
PRINT a; :PRINT " ";
a = a * (x – y)/(y + 1)
REM y = y + 1 (performed by NEXT)
REM End of inner loop
NEXT
PRINT
REM End of outer loop
WEND
END
I added code to print the initial row containing "1". As coded, the rows are displayed flush left on the screen. On the flowchart, in the computation box just below the "print space" box, it should be z– instead of s–.
algorithm and flowchart are very useful..thanks a lot